 mortgagetape™
Insights
Original loan-level research on US housing finance, drawing on the full HMDA, GSE, and Ginnie Mae loan-level disclosure record. Each post is data-led, methodology-transparent, and informational only — not investment, lending, or compliance advice.
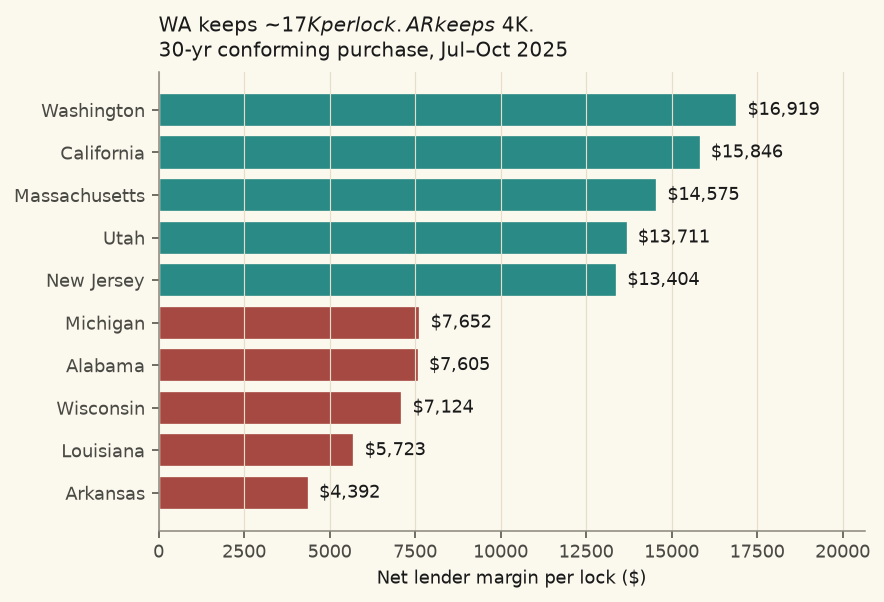
The $13,000 question: why lender margins swing 4x across US states
On the same product — a 30-year conforming purchase lock — net lender margin per loan ranges from **$16,919 (Washington) to $4,392 (Arkansas)** across the 30 US states with at least 300 locks in Jul 1 – Oct 10, 2025. That is a **3.85× gap** in what a lender keeps on an identical product. In basis points of loan amount, the range is 148 (Arkansas) to 359 (Ohio). Points and dollars rank the states differently: small-loan states lead on points (Ohio 3.59, NY 3.32, PA 3.09, IN 3.06) because lenders compensate for small loan sizes with more points; big-loan states lead on dollars (WA $16.9K, CA $15.8K, MA $14.6K, UT $13.7K) because even a modest point-margin compounds through a big loan. The two metrics are nearly uncorrelated at the state level — lenders appear to target per-lock dollar contribution, not per-lock percentage. One market stands out as a structural anomaly: **Colorado**. Avg loan size $483K — identical to Utah's $483K — but Colorado lenders keep only $9,695 per lock vs Utah's $13,711. That is a 98-bp, ~$4,000 shortfall on identically-sized conforming purchase loans. Loan size, channel mix, and LLPA burden all fail to explain it. Four states (AR, LA, WI, AL) sit below $8K per lock, materially under the ~$9-13K floor the top-25 origination states cluster around. For MSR traders and M&A analysts, the geographic mix of a lender's pipeline is a legitimate normalization input — a Washington lock is worth 3.85× an Arkansas lock in dollar terms before any operational advantage.
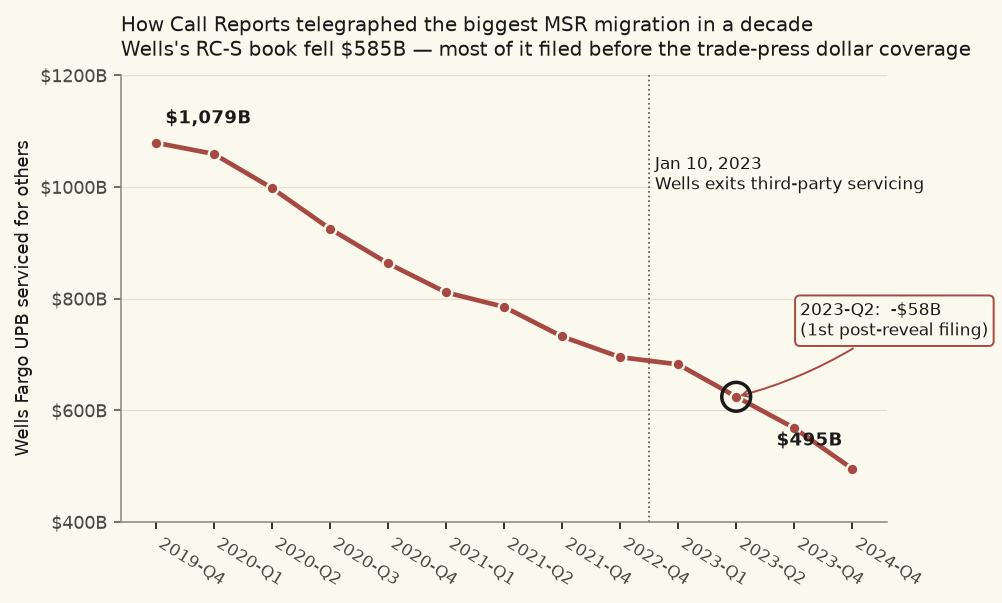
How Call Reports telegraphed the biggest MSR migration in a decade
Between year-end 2019 and year-end 2024, the bank-held 1-4 family mortgage servicing book shrank from $2,749B to $2,288B — **$461B gone** across the ~80 banks that file FFIEC Call Reports. Wells Fargo alone ran off $585B (-54%); Bank of America ran off $102B (-57%). Banks lost **11.2 points of share** of the attributable 3-agency servicing book over five years. Wells's quarterly trajectory shows a $58B single-quarter drop at 2023-Q2 — the first Call Report after Wells's April 2023 earnings-call reveal of a ~$50B package to Mr. Cooper. Call Reports arrive on a 30-day lag; they quantify what actually closed before most trade-press post-close coverage runs. The migration is a split story: GSE flow went mostly bank-to-bank (JPMorgan Chase +$338B, PNC +$113B, Truist +$96B); Ginnie flow went almost entirely bank-to-non-bank (Freedom +$208B Ginnie, Lakeview +$167B, Rithm/NewRez +$100B). Capital rules bite hardest on Ginnie, and the data shows exactly that pattern (-16.7 pts Ginnie share vs -11 to -13 pts on the GSEs). Separately, a substantial piece of Wells's $585B drop (~$359B) and nearly all of BofA's $102B (~$106B) lives outside agency pools — private-label, portfolio, HELOC, FHLB-held — invisible to any pool-level file but visible on RC-S. **FFIEC Call Reports see portions of the mortgage servicing market that agency pool disclosures cannot.**
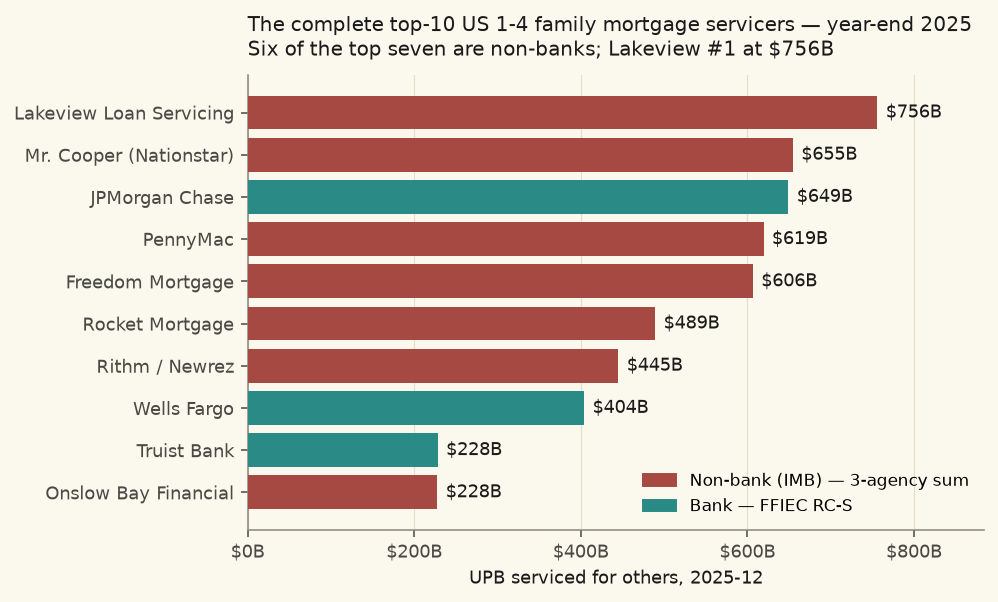
The complete 1-4 family mortgage servicing league table — bank + IMB, year-end 2025
Industry trade press publishes bank-only and agency-only mortgage servicer rankings side-by-side. Inside Mortgage Finance publishes a combined primary-servicer top-25 inside its paid subscription product. What has been missing from any public source is a **loan-level reconciliation** cross-referencing FFIEC Call Report RC-S against Fannie SFP + Freddie SLLD + Ginnie llmon2 and surfacing the private-label residual that falls out when a bank's RC-S total exceeds its agency attribution. This piece builds that view at year-end 2025. **Lakeview Loan Servicing is #1 overall at $756B** — a capital-markets intermediary that dominates Ginnie co-issue aggregation and is 48% larger than JPMorgan Chase. Mr. Cooper is #2 at $655B; JPMC #3 at $649B; PennyMac #4 at $619B; Freedom #5 at $607B. **Six of the top seven are non-banks.** Separately, every big bank in mortgage servicing holds a non-trivial non-agency private-label residual: JPMC $124B, Wells $103B, US Bank $46B, Truist $41B, PNC $33B. Bank of America is at #8 among banks ($69B RC-S), below Fifth Third and Citizens — the post-2008 money-center retreat that never got rebuilt. Methodology aside: Fannie Mae quietly ended public full-book servicer disclosure at December 2025.
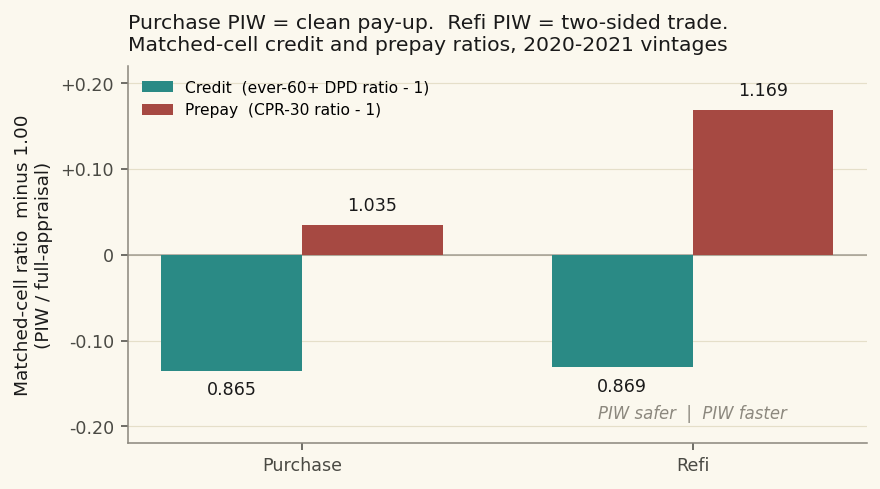
PIWs are safer AND faster — the offset every MBS desk should be running
Yesterday's PIW performance piece established the credit pay-up: 2020–2021 waived loans hit ever-60+ DPD at ~87% of the full-appraisal rate after matching. The sophisticated reader's next question is the offset — do PIW loans prepay faster too? On the same matched-cell framework: purchase PIW loans prepay only **3.5% faster** than full-appraisal peers (CPR-30 ratio 1.035); refi PIW loans prepay **17% faster** (1.169). Purchase PIW is a clean pay-up (credit dominates). Refi PIW is a two-sided trade whose net depends on pool coupon and OAS regime — refi net-pay-up crosses from positive into discount territory somewhere in the 6.5–7.0% coupon range at tight OAS. The rate-regime cut shows the mechanism: PIW borrowers respond 20% faster than full-appraisal peers on the *middle regime* (loans that acquired ITM incentive after origination), not on the locked-out or born-ITM ends. Response-to-incentive, not base attentiveness. Load-bearing confirmation: the survivorship-conditioned matched-DPD test moves the credit ratio to 0.831 (P) / 0.851 (R) — *lower*, not higher, than unconditioned. Burnout is disconfirmed as the mechanism. Two independent PIW effects, both structural. Built on Fannie SFP + Freddie SLLD (17.4M loans through 2020–2021 + 3.7M 2022–2024) with Optimal Blue CDL+ retail lock median for the rate-regime classification.
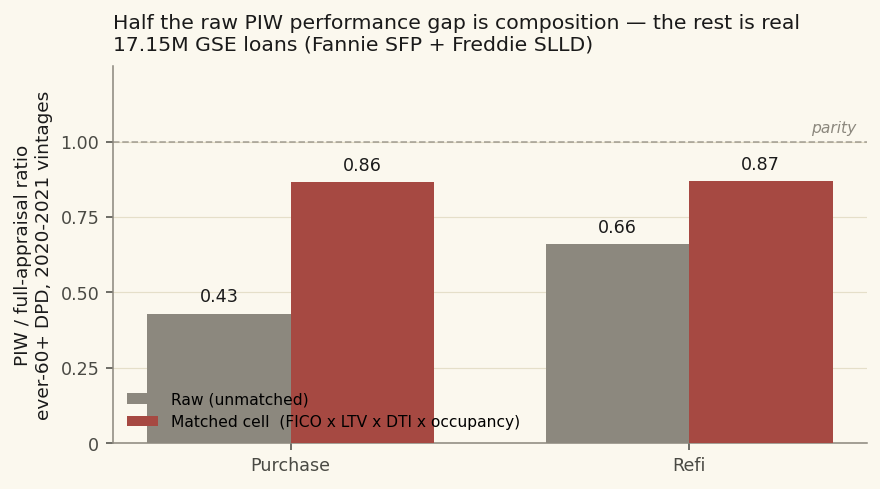
The appraisal-waiver boom vintages, five years later — the waivers held to their peers, and then some
The industry debate on Property Inspection Waivers has run on the same two-sided intuition for a decade — positive selection (GSEs waive on pre-screened low-risk loans) versus negative selection (the appraisal was catching valuation games). Neither side has been adjudicated with public loan-level evidence. The 2020–2021 vintages settle it. Across 17.15M GSE loans (6.94M waived, 10.21M with a full appraisal), the raw PIW-vs-full-appraisal ever-60+ DPD ratio is 0.43 on purchase and 0.66 on refi — but roughly half of that gap is composition. After matching on FICO × LTV × DTI × occupancy, the ratio settles at **0.865 on purchase and 0.869 on refi** — a ~13% relative outperformance that widens to 0.83 on ever-180+ DPD and reproduces at credit-event incidence (0.25–0.63 of the full-appraisal event rate). Every hypothesis that would refute it — HPA masking, current-LTV rematch, purchase-refi divergence — fails. Match on current LTV and the purchase ratio *strengthens* to 0.697. The waiver-eligibility screens (AVM confidence, DU/LP gate, pre-2025 80% LTV cap) are picking, not hiding.
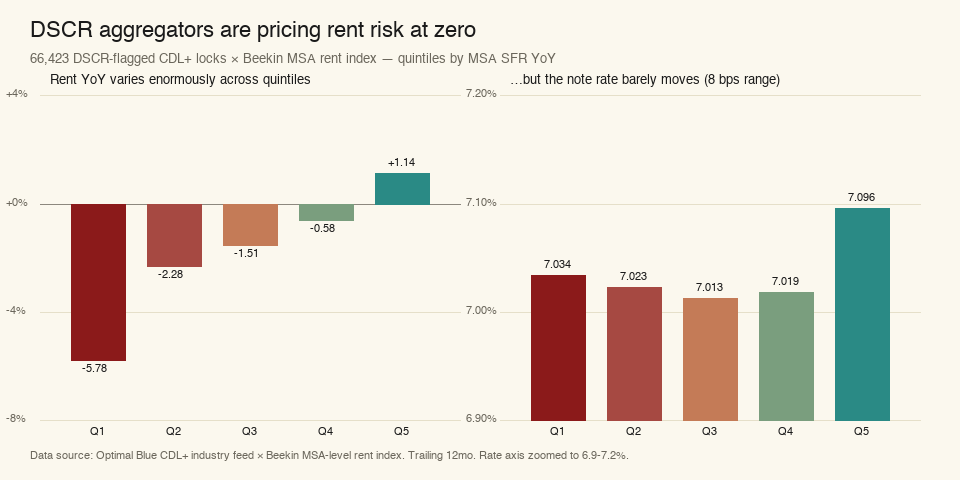
DSCR aggregators are pricing rent risk at zero
Across 66,000 DSCR-flagged non-QM locks joined to Beekin's MSA rent index, three findings stand up. (1) Rate premium is flat across rent quintiles — 7.01–7.10%, an 8 bps spread against an SFR YoY range of −5.8% to +1.1%. The market prices rent risk at zero. (2) 40–50% of DSCR originations in Cape Coral, Miami, Grand Rapids, and San Antonio now sit below the 1.25× covenant after applying MSA rent shock — Miami alone is $233M UPB in the breach band. (3) In the worst rent-decline MSAs, adjusted current LTV runs 4–12 pp above what an appraisal-anchored LGD model reads. Investor loans are systematically under-reserved.
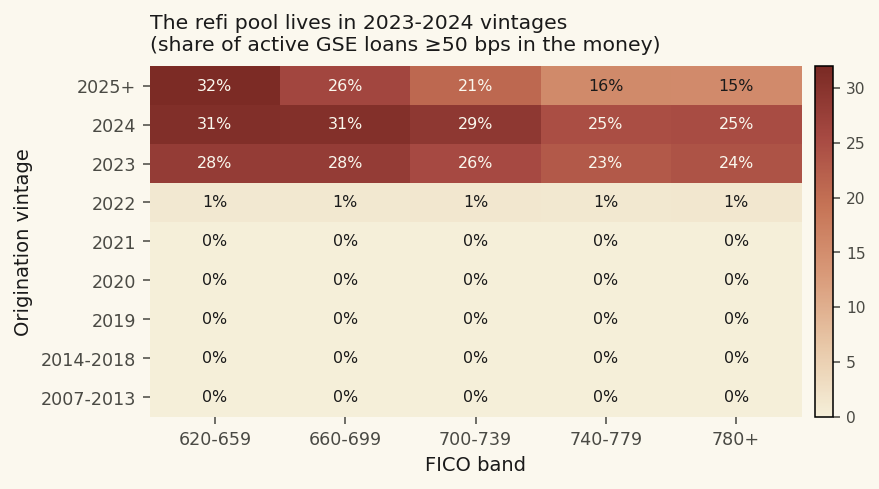
Refi pool charged properly: $70B, not $290B
The refi pool looks like $291B when you use a purchase-median headline rate. It's actually $69B — a 76% haircut — once you charge borrowers the ~40 bp LLPA that refi rates run above purchase on the current Fannie grid. At the traditional 100+ bp 'call the borrower' cutoff the pool shrinks from $61B to $7B. What's left concentrates in the 2023–2024 vintage (23–31% ITM across all FICO bands) plus the low-FICO tail of 2025+ (620–699 borrowers still 26–32% ITM). Pre-2022 is 0.0% ITM at every FICO band. Every prepay S-curve anchored to a purchase-median headline rate overstates refi incentive by about a third — a full LLPA cycle. Built on Fannie SFP (12.5M loans) + Freddie SLLD (8.3M) + FHFA MSA-HPA + Optimal Blue CDL+ retail rate anchor.
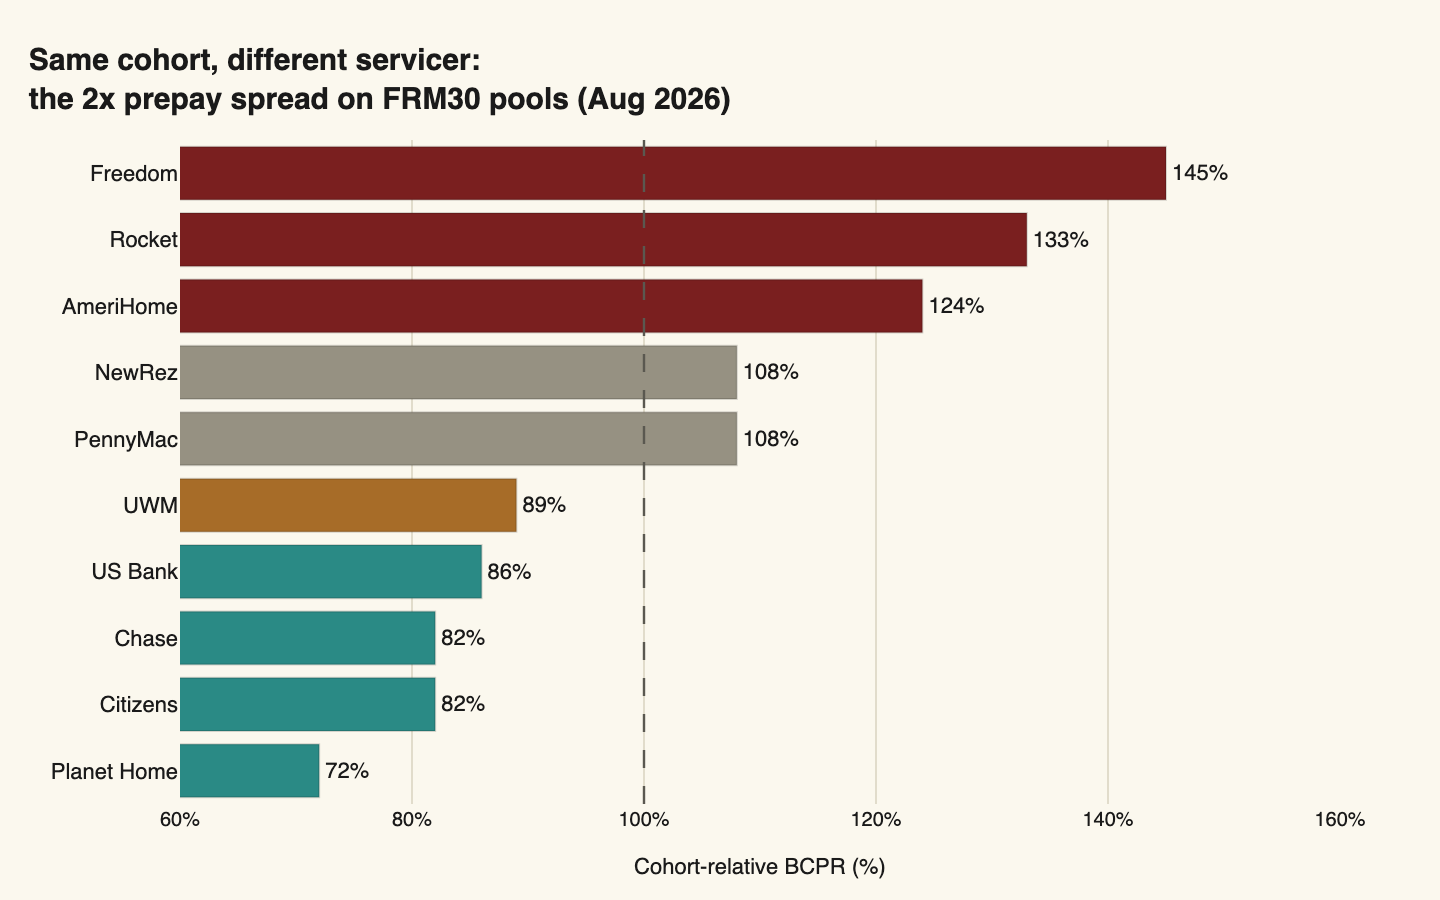
Same cohort, different servicer: 2x prepay spread
Follow-on to the recapture-mismatch MSR piece, using Fannie's own Data Dynamics BCPR feed to measure the tier gap directly. August 2026 all-cohort FRM30 BCPR is 7.9%, but the top-25 servicers spread from 72% to 145% of their own cohort baseline — a 2x cohort-normalized range on the same product. Freedom 145%, Rocket 133%, AmeriHome 124% (recapture-active); Planet Home 72%, Chase 82%, Truist 83% (recapture-passive aggregators absorbing the leakage). Rocket + AmeriHome accelerated month-over-month; Freedom softened. On the same $1B UPB book, the tier spread translates to ~$57M of MSR value differential over 3 years, from a public monthly Fannie file.
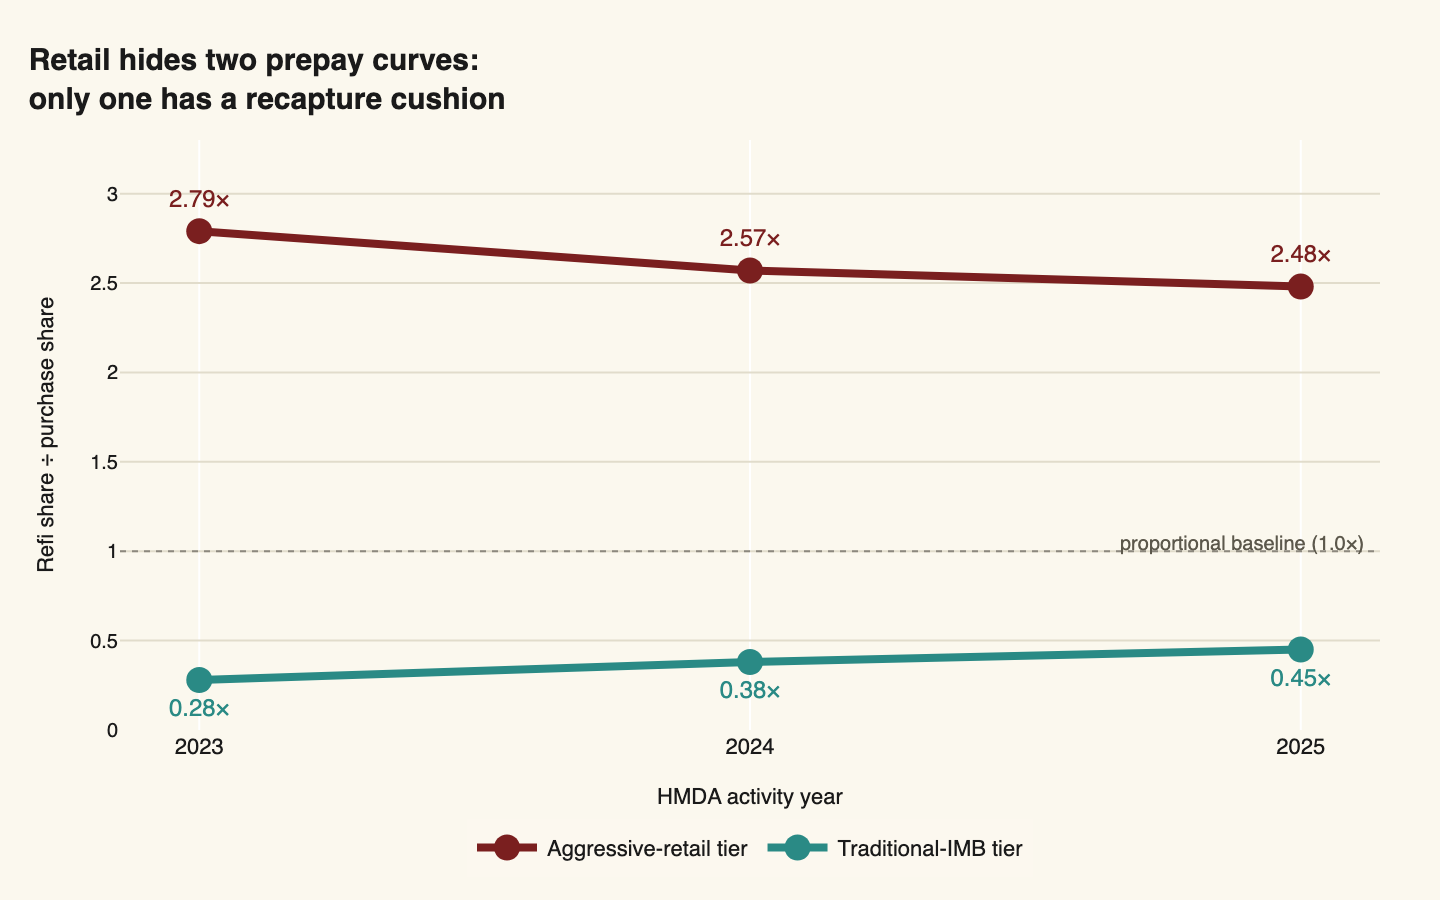
Retail hides two prepay curves — only one recaptures
Follow-up to a reader question on the broker-vs-retail flip piece: does retail actually hide two prepay curves under one WAC assumption, and does recapture widen the gap further? Loan-level cumulative prepay diverges only modestly (~0.5-1.5 pp) once you match FICO × LTV × coupon cells. But the HMDA 2023-2025 recapture-share proxy is a 5.5-10× spread: aggressive tier originates refis at 2.5-2.8× purchase baseline, traditional-IMB tier at 0.3-0.5×. Traditional-IMB borrowers who refinance overwhelmingly leave for aggressive-tier competitors. MSR value impact on identical-composition pools is 3-4× larger for traditional-IMB books because there's no recapture cushion.
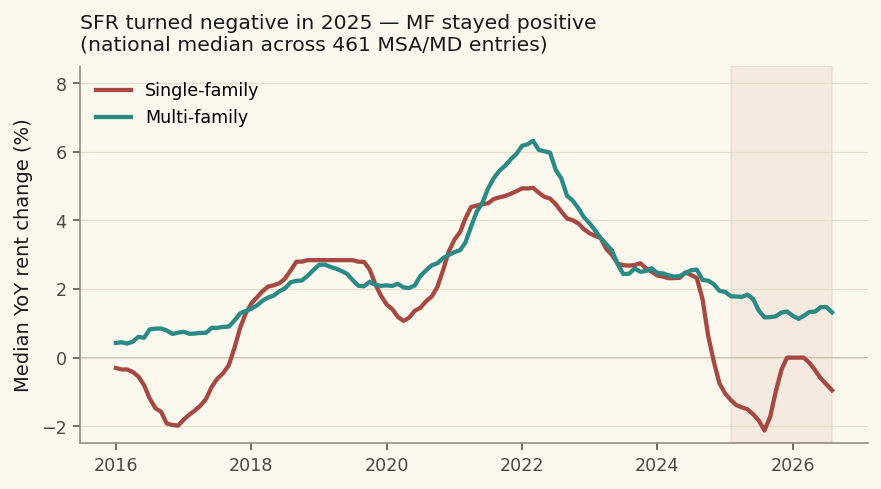
Rental market split: SFR fell, MF held
Single-family and multi-family rents moved in lockstep for nine years (2016–2024 YoY correlation: 0.94). Then in early 2025 they split, and the gap held. At Aug 2026 median SFR YoY is −0.95% while MF is +1.32% — a 2.3 pp spread sustained for 18 months across 34 of 35 major MSAs. Deepest SFR corrections: Detroit −6.9%, Miami −6.3%, Phoenix and San Antonio −3.4%. Strongest MF: SF Bay +7.2%, San Jose +7.1%, Chicago +3.9%, NY +3.7%. Every DSCR-underwriting, aggregator-conduit, and non-QM origination question that assumes a single national rent trajectory is now wrong. Aggregate indices (ZORI, BLS OER) don't split by property class, so the signal is invisible in the standard data feeds.
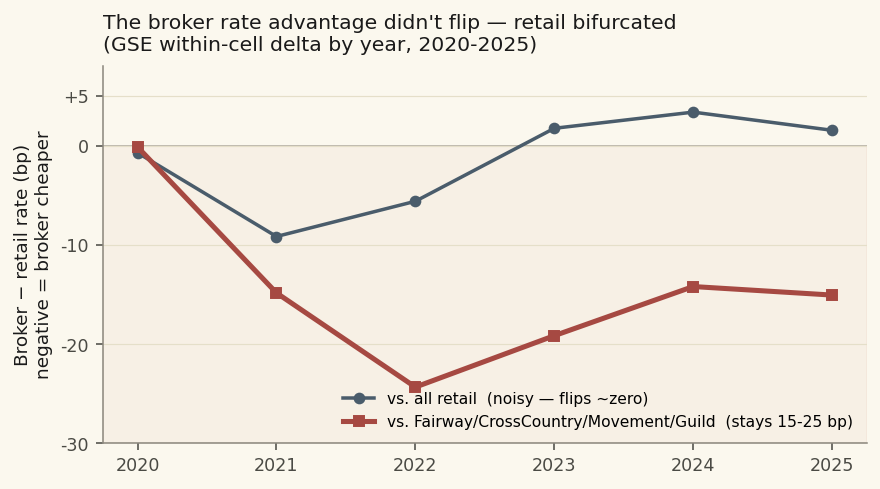
Broker rate advantage didn't flip — it bifurcated
The aggregate story is boring: brokers saved borrowers 9 bp in 2021 and cost them 3 bp by 2024. The story underneath the aggregate is not. Within-cell across ~6.5M GSE + Ginnie originations 2020–2025, brokers still beat traditional IMB retail (Fairway, CrossCountry, Movement, Guild) by 14–24 bp every year through 2025 — no reversal. Against the aggressive-marketing retail cluster (Rocket, JPMC, Wells, PennyMac) brokers went from 9 bp cheaper to 3 bp more expensive. Same channel debate, two opposite answers depending on which retail lender is in the room.
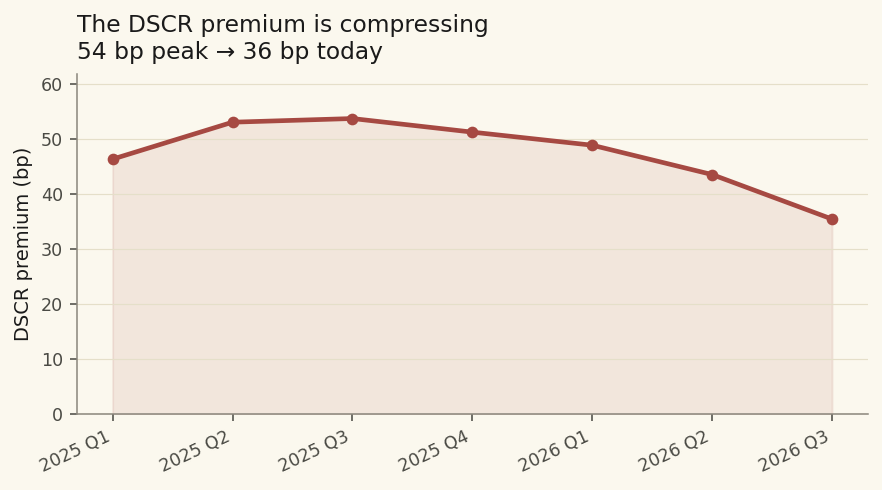
DSCR premium: how non-QM investor pricing compressed
Optimal Blue lock data across 2025-2026 shows the DSCR premium is neither a single number nor stable. The premium ranges from 26 to 109 basis points across the FICO x LTV grid — driven more by LTV than by borrower credit — and the workhorse cell (720-759 FICO, 65-75% LTV) has compressed 18 bp over the past year, from a 54 bp peak in Q3 2025 to 35 bp in Q3 2026. Three mechanisms are pushing the compression simultaneously: capital deepening as more issuers enter the private-label DSCR securitization market, underwriting maturation as three years of vintage seasoning produces credible performance data, and competitive pressure on aggregators. Which mechanism dominates determines whether the trajectory continues to parity with GSE-investor pricing by mid-2027 or partially reverses. Composition is moving too: Investor-DSCR grew from ~28% to ~34% of the non-QM total over the same window (per OB Market Advantage segmentation), so some of the aggregate compression may be mix and the rest is a real within-cell price signal. About 8-9% of DSCR locks carry a ratio below 1.0 (an accepted underwriting norm, trending slightly down) and 48% pile up in the 1.00-1.15 band right above the underwriting floor — the segment to watch for stress-cycle behavior.
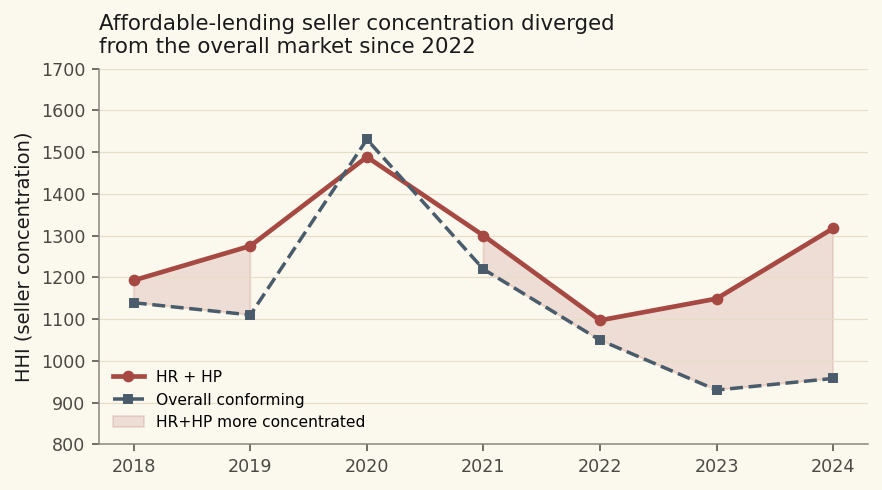
HR & HP: affordable-lending seller map redrawn
Article 3 in our HomeReady + Home Possible series. Between 2018 and 2024, the top-15 HR + HP seller list turned over meaningfully. Wells Fargo went from 18.5% of the market to 1.2% — a 17-point collapse tied to its post-2022 retail-mortgage exit. Rocket Mortgage rose to 10.7% and is now the #1 named seller. UWM emerged from nothing to 9.2% via broker-channel expansion. Concentration divergence: overall conforming HHI fell from 1504 (2020) to 966 (2024) as the market fragmented, but HR + HP HHI held at 1150–1320 and is now 353 points more concentrated than the market it lives in. Specialization index spans 13x — from Freedom Mortgage (0.14) to Rocket (1.80). IMB retail over-indexes; correspondent aggregators (PennyMac, AmeriHome, NewRez, Freedom) and homebuilder captives (Lennar, DHI) systematically under-index. The CRA hypothesis (that HR + HP is bank-led for CRA credit) is not confirmed at aggregate — depositories mostly under-index the programs.
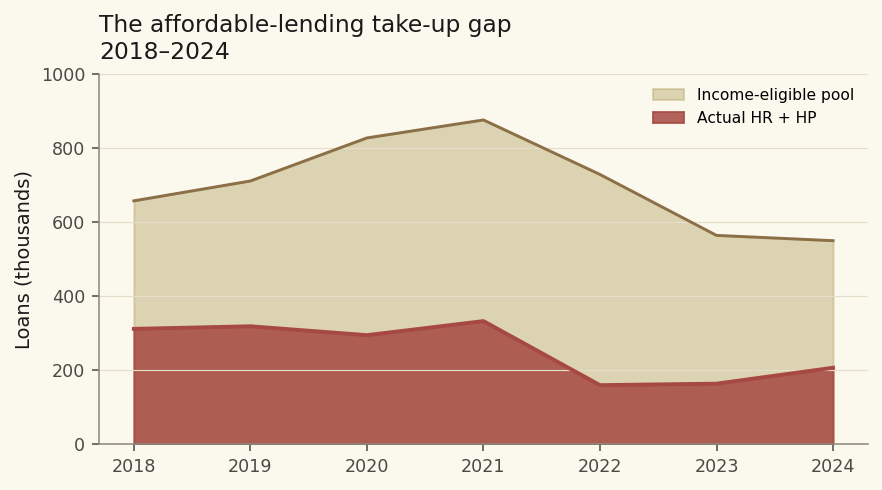
HR & HP take-up gap: 62% of eligible borrowers skip
Article 2 in our HomeReady + Home Possible series. HMDA-derived income data reveals that 26% of conventional conforming purchase borrowers are income-eligible for HR + HP (below 80% AMI) — roughly 550,000 loans per year. Only 207,000 actually get one, a 38% take-up rate. The remaining 343,000 income-eligible borrowers land in standard conventional financing. The gap has widened structurally: pre-COVID take-up was 47%; post-shock recovery has plateaued at 38%. State-level take-up varies 4x, from 15% (Mississippi) to 59% (Maryland). The eligibility distribution is smooth around the 80% AMI ceiling — this is a delivery-system gap, not an eligibility-design problem. Cross-links to Article 1's geographic-rotation finding: the coasts lost affordable share because their eligible pools shrank; the midwest gained because their eligible pools held up. In both regions, the programs still miss most of the borrowers they were built for.
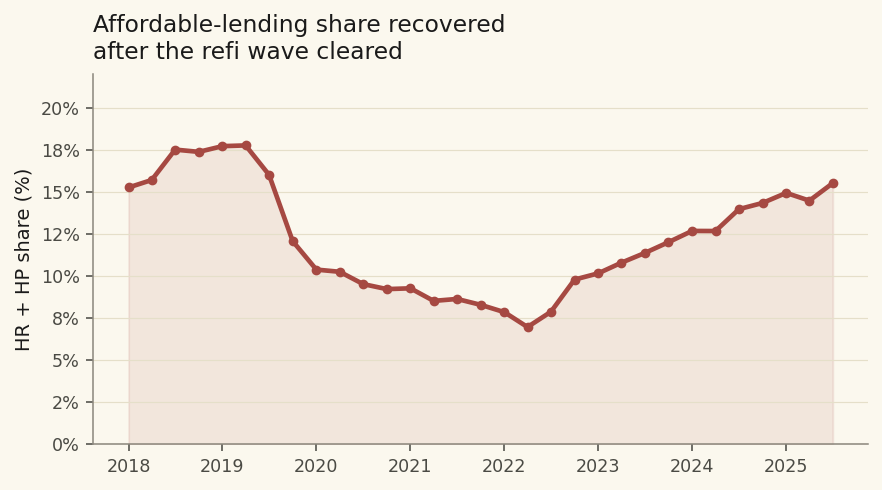
HR & HP through the rate shock: stable share, new borrowers
HomeReady and Home Possible — the Fannie and Freddie affordability programs — held their share of GSE conforming purchase originations through the 2022 rate shock. The share crashed from 17.8% (2019 baseline) to 7.9% (2022 Q1 refi-wave trough) then recovered to 15.5% by 2025 Q3, within 2 pp of the pre-COVID mark. But composition rotated dramatically: the heartland gained share (IN +9.7 pp, IA +8.1, SD +7.1, OH +4.7) while coastal and mountain-west boom markets lost (ID −12.9, DC −12.3, UT −10.6, AZ −10.6, WA −10.2, MA −10.0, NV −9.4) as home-price growth pushed program-eligible incomes out of range. The post-shock cohort itself is different: mean LTV dropped from 92% to 85%, FTHB share dropped from 79% to 74%, mean DTI rose from 39% to 42%. Programs designed for high-leverage first-time buyers are now being used more by repeat buyers stretching for the LLPA pricing advantage in a high-rate environment.
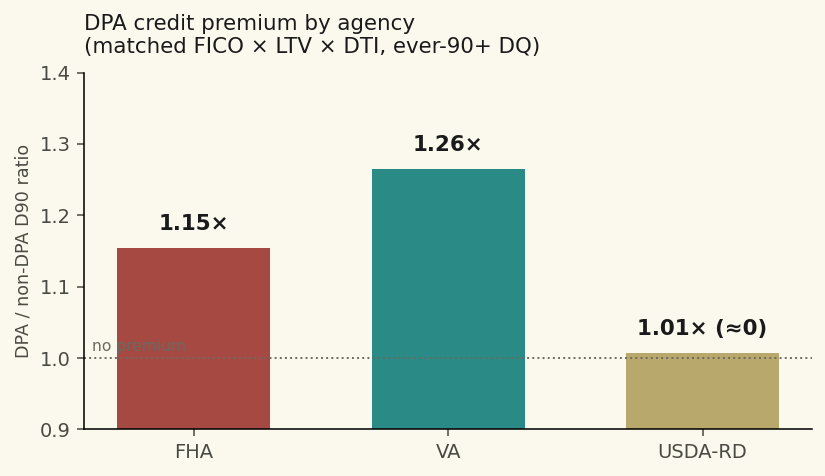
DPA credit premium: real in FHA, bigger in VA
Ginnie Mae's per-loan down-payment-assistance flag on 17.7 million purchase originations lets us test whether the raw DPA-vs-non-DPA delinquency gap survives matched underwriting. On FHA it does — a 15.4% ever-90+ DQ premium at matched FICO × LTV × DTI on 1.36 M DPA and 7.78 M non-DPA loans across 108 matched cells. On VA the residual is bigger, 26.4%. On USDA it collapses to zero. The FHA premium held at 1.15–1.23 for 2013–2022 vintages, then widened to 1.44 in 2023–2024 as post-COVID non-DPA quality improved but the DPA book didn't. Pool-level: FHA pools with >80% DPA share run 7pp higher D90 than modal pools — an investor-priceable buyout-speed premium.
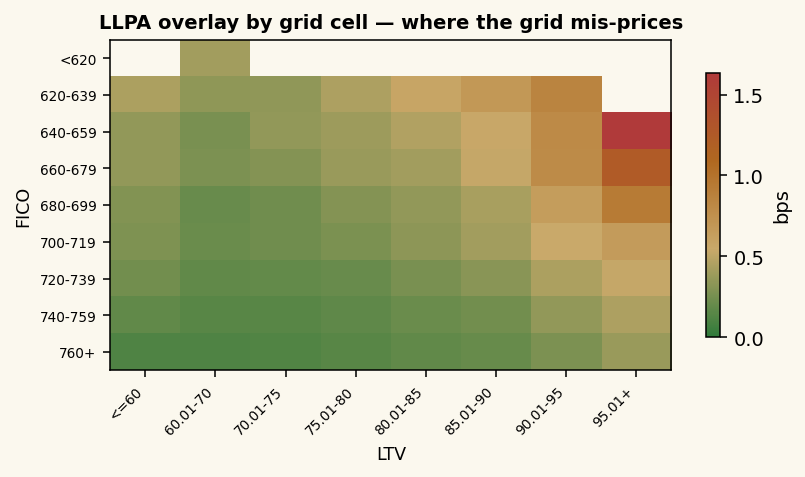
LLPA overlay model for capital markets
We built a within-cell residual model that predicts the credit-loss expectation the Fannie/Freddie LLPA grid leaves unpriced. Two-stage HistGradientBoosting + isotonic, trained on 12M GSE loans, validated on 1.25M OOT. Output is an ordinal band + decile (rank-order is load-bearing; raw bps is informational). Built for rate-sheet engineers, MSR owners, and secondary-marketing desks who need a defensible, quantified answer to 'how much should I charge above the grid?'
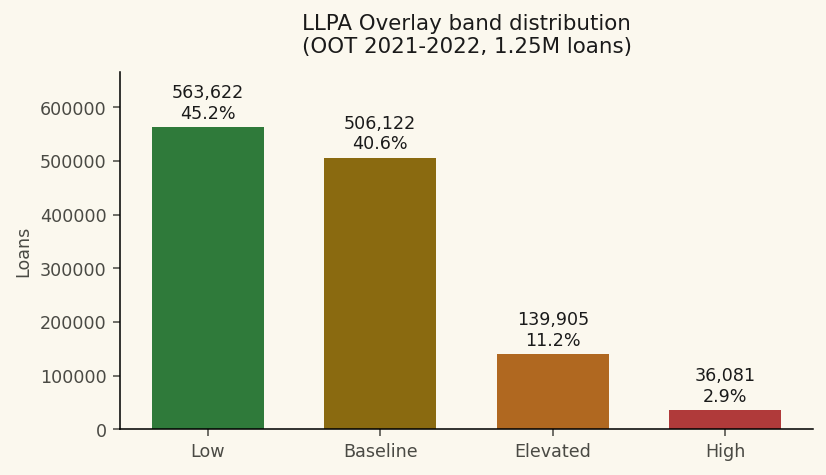
Beyond the grid: what LLPA leaves unpriced
Two loans with identical FICO and LTV can have very different long-run credit performance. The Fannie/Freddie LLPA grid prices them the same; the world doesn't. We built a model that quantifies the within-cell residual — the credit-loss expectation the grid leaves on the table — and ships it as a simple band (low / baseline / elevated / high) plus a decile rank. Here's what the model does, what it doesn't do, and how to use it across the origination and capital-markets stack.
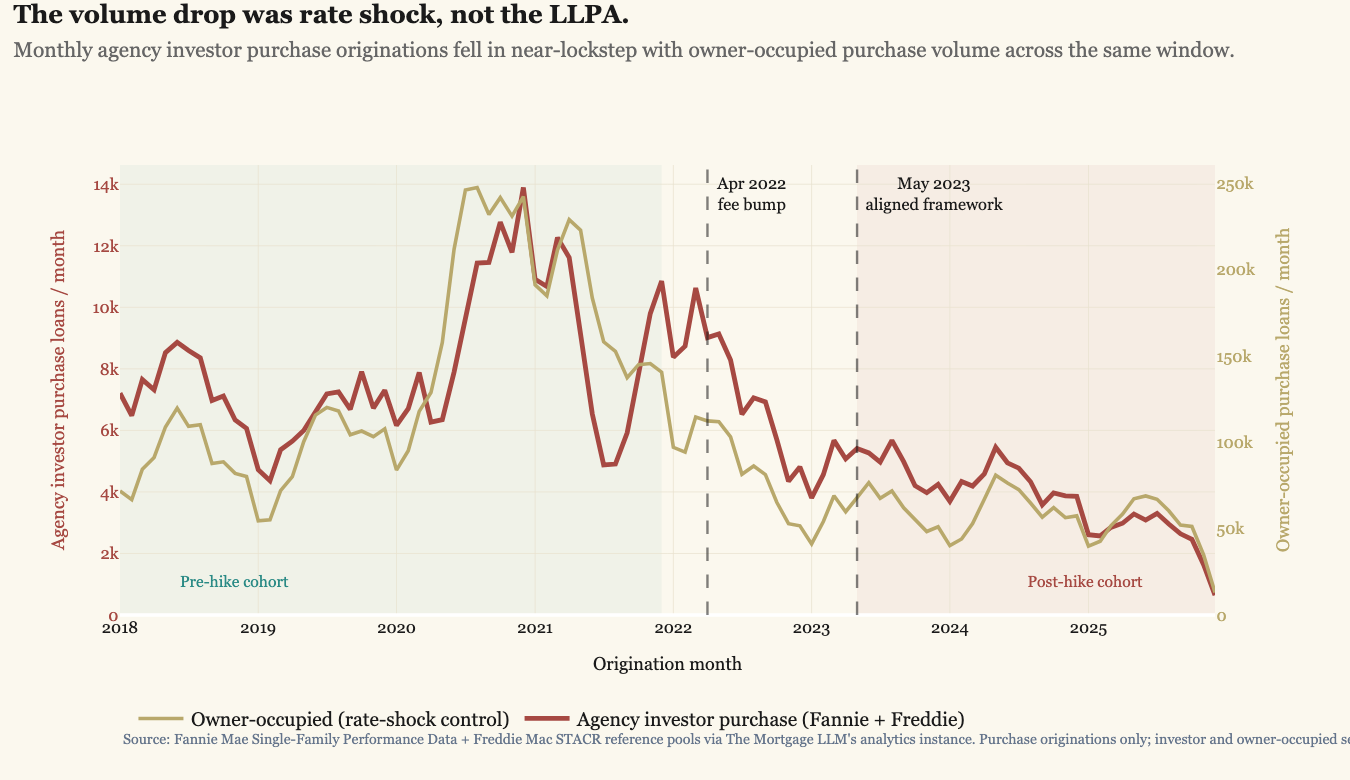
What the investor LLPA hike actually did
The 2022-2023 investor LLPA hike moved top-of-grid pricing from ~175 bps to ~400 bps. Three years of loan-level GSE performance data lets us answer what it actually accomplished. The volume story is mostly rate shock plus a real LLPA overlay: agency investor purchase originations fell ~57% by count from Q4 2021 to Q4 2024, while owner-occupied fell 48% in the same window. Rate shock explains ~84% of the drop (the shared baseline both cells shared); the LLPA is a real incremental ~9pp drag on top specific to the investor cell. What the fee unambiguously did was select. The surviving agency investor book shows p10 FICO up 10 points, mean LTV down 2.7pp, state mix rotated away from CA/AZ/CO/WA toward TX/OH/NC/TN, and in matched FICO/LTV cells the post-hike cohort experiences 22-25% of the pre-hike early-stress rate. About 4pp of the investor purchase market shifted from agency execution to private-label / bank portfolio channels between 2021 and 2024 - real substitution, but a modest one, and disproportionately the marginal risk the LLPA was designed to price out.
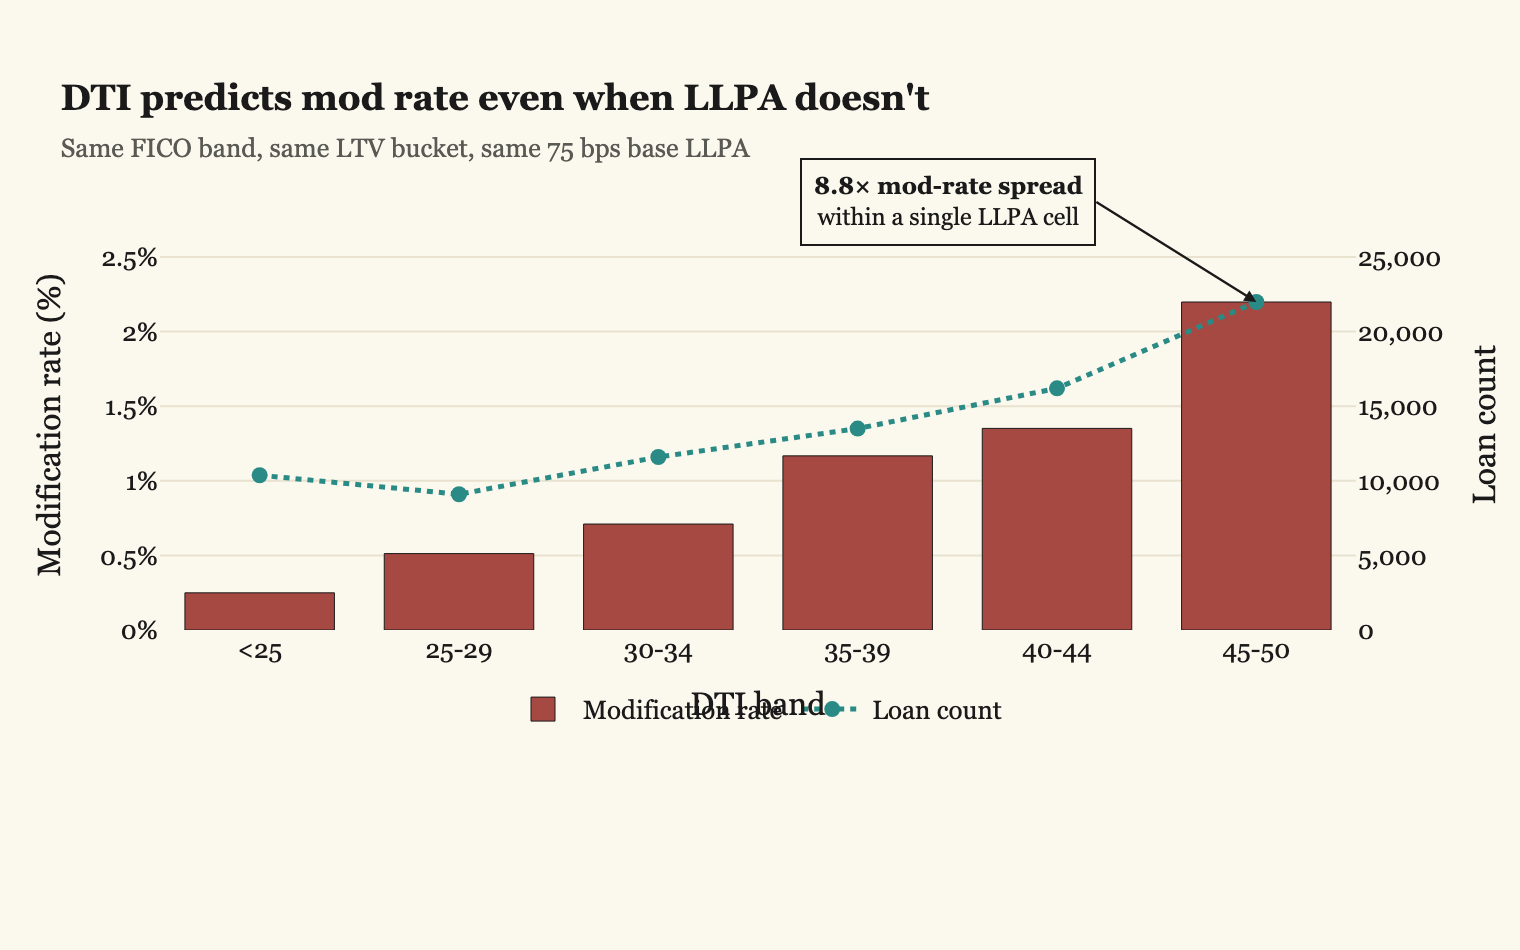
LLPA grid prices only politically tolerable risk
The Fannie/Freddie LLPA grid prices what's politically acceptable, not what's actuarially complete. Within a single LLPA cell — same FICO band, same LTV bucket, same 75 bps base fee — modification rate varies 8.8× across DTI sub-bands and ~11× across states. The DTI gradient is independent of note-rate-based pricing: it persists 4-7× within every rate band. The unpriced risk doesn't vanish — it migrates to MSR strips, spec pool pay-ups, lender overlays, and ultimately to borrower-facing rate spread. A descriptive map of where the risk function flows, useful for loan officers, capital markets desks, MSR owners, and rate-sheet engineers.
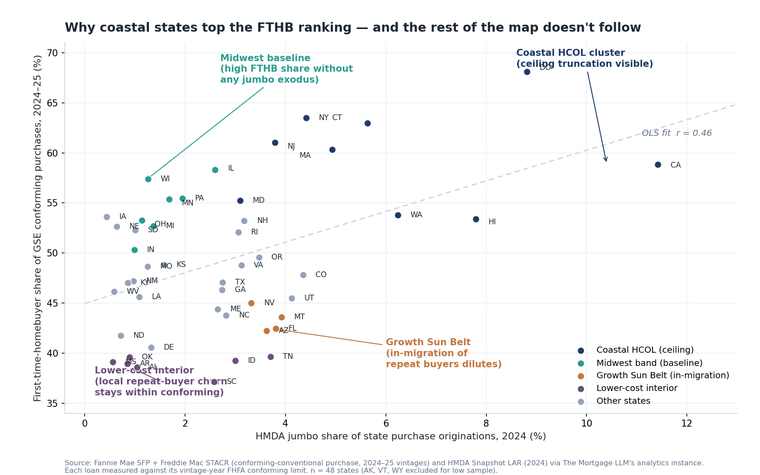
Who actually got to be a first-time buyer in 2025
The conventional read of the first-time-buyer market follows the buyer-migration map — where people are moving, that's where the starters cluster. The agency data inverts the picture. On Fannie and Freddie conforming purchase originations in 2024-25, first-time buyers are the largest share of the active purchaser pool in the coastal high-cost states (DC 68%, NY 64%, CT 63%, NJ 61%, MA 60%, CA 59%) and the smallest in the lower-cost interior and growth Sun Belt (SC 37%, AL/MS 39%, FL 42%, AZ 42%). The 31 pp spread is driven mainly by the conforming-loan-limit ceiling pushing coastal move-up buyers into jumbo, but two other forces — the Midwest demographic baseline and Sun Belt equity-rich in-migration — carry most of the residual.
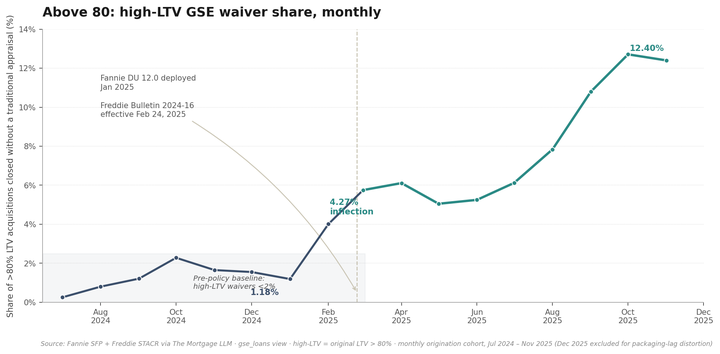
Above 80: the GSE appraisal-waiver ceiling fell
For most of the past decade, conventional conforming appraisal waivers were capped at 80% loan-to-value. That ceiling fell quietly in early 2025 — Fannie's DU 12.0 release in January and Freddie's Bulletin 2024-16 effective February 24 extended pure waivers to 90% LTV and Property Data Collection waivers to 97% LTV. In the loan-level data, Fannie's high-LTV waiver share quadrupled from 1.18% in January to 4.27% in February 2025, then climbed to 12.4% by November. At 95+ LTV the policy fingerprint is exact: every waiver in the sample is a PDC waiver. Fannie and Freddie diverge on the rebuild — Fannie betting on PDC adoption, Freddie betting on pure ACE recovery.
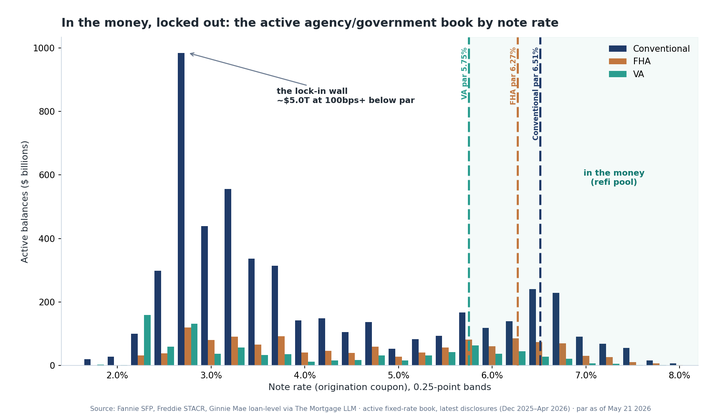
In the money, locked out: where the refi book is
About $289 billion across roughly 1.05 million loans in the active agency and government book sits at least 75 bps in the money to refinance today — a real, callable pipeline a loan officer can rank by state, product, and vintage. It is also a sliver: only 4% of a $7.1 trillion book, sitting on top of $5.0 trillion (71% of the book) locked in a full point or more below par. The refi pool is disproportionately a government story (6.0% of FHA, 7.1% of VA vs. 3.0% conventional), heavily concentrated in 2023-2025 vintages (~93% of the pool), and densest in the lower-cost interior (Oklahoma 7.6%, Ohio 6.4%) even though Texas, Florida, and California lead by raw dollars.
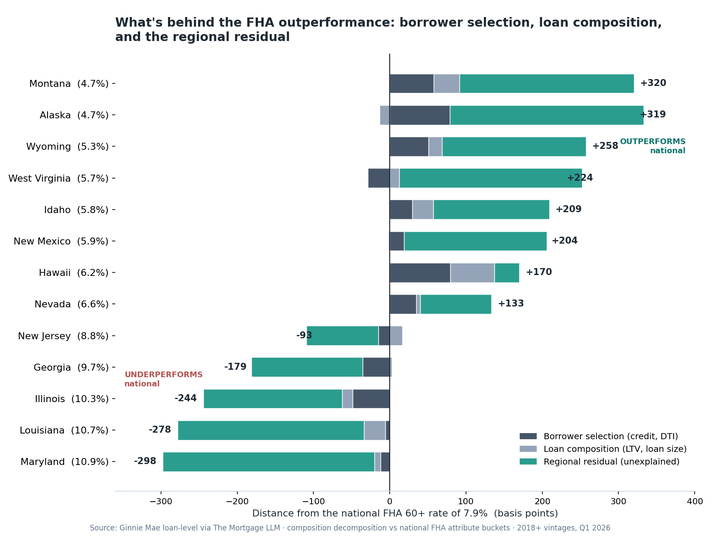
Where, not who: 8 states beating the FHA cycle
Eight states are running 130 to 320 basis points below the national 7.9% FHA 60+ delinquency rate — Alaska, Montana, Wyoming, West Virginia, Idaho, New Mexico, Hawaii, and Nevada. A Shapley decomposition into borrower selection, loan composition, and regional residual finds that only about a quarter of the gap is explained by who these states lend to or what they originate. Three-quarters is geography — the accumulated home equity cushion that doesn't show up in origination-time FICO or LTV but lands squarely in the residual. Hawaii is the lone exception where loan mix does the work; West Virginia outperforms by 224 bps despite a mean FICO 10 points below the national average.
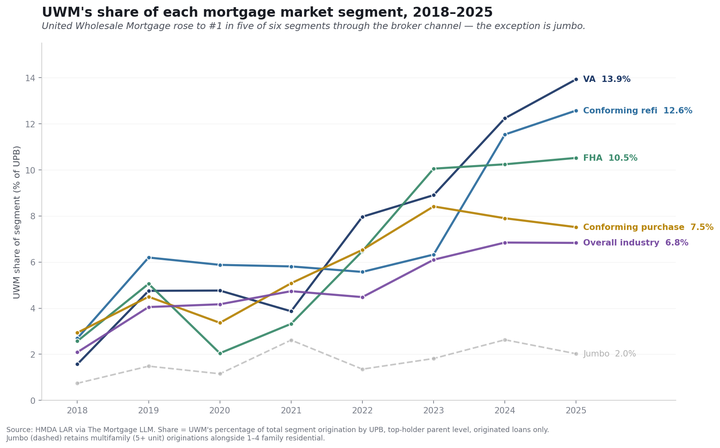
How UWM took the top of US mortgage lending
By year-end 2025, United Wholesale Mortgage was the largest originator in five of the six major segments of US mortgage lending — overall, conforming purchase, conforming refinance, FHA, and VA — all through a single distribution channel: independent mortgage brokers. The lone holdout is jumbo. Chronology of a six-year takeover + the structural boundary the wholesale model has yet to cross.
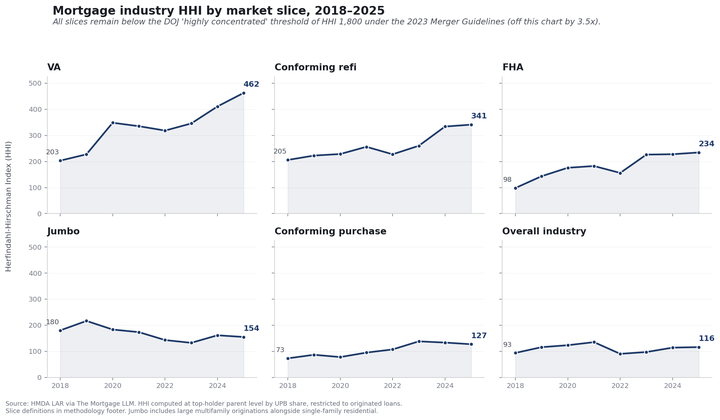
How concentrated is the mortgage industry? HHI 2018–25
Across HMDA's full 2018–2025 origination disclosure, every market slice in US mortgage origination sits far below the DOJ 'highly concentrated' HHI threshold of 1,800 under the 2023 Merger Guidelines — the most consolidated slice (VA) is at 463, the least (overall) at 116. The structurally novel pattern is United Wholesale Mortgage's emergence as the top originator across five of six slices post-2020. Six-slice HHI map + slice-by-slice top-5 analysis.
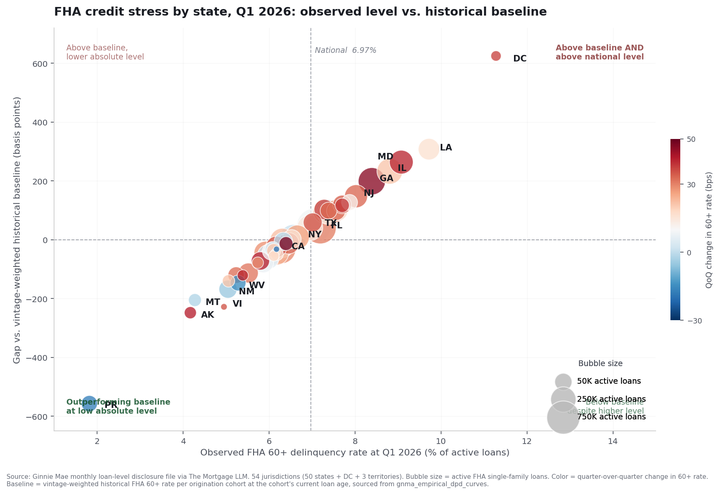
Where the FHA credit stress is concentrating
The national FHA 60+ rate hit 6.97% in March 2026, but the real story is state-level: a 5pp spread between the most- and least-stressed states, with 10 states running more than 100bps above their vintage-weighted historical baseline. State-level decomposition + baseline-gap analysis.